LUMAX Industries | Q1FY20
August 09, 2019
LUMAX Industries
BUY
Y/E March (` cr)
1QFY20
1QFY19
% yoy 4QFY19
% qoq
BUY
Net sales
402
482
(17)
433
(7)
CMP
`1,290
EBITDA
38
41
(5)
31
25
EBITDA margin (%)
9.5
8.4
112bp
7.1
242bp
Target Price
`1,669
PAT
17
20
(17)
14
16
Investment Period
12 Months
For 1QFY2020, Lumax Industries Ltd. (LIL) registered ~17% de-growth on yoy basis
Stock Info
on the consolidated revenue front to `402cr as compared to `482cr. Operating
Sector
Auto-Ancillary
margin improved by 112bps to 9.5%. On the bottom-line front, the company has
Market Cap (` cr)
1,206
Beta
1.3
reported de-growth of ~17% due to poor sales performance.
52 Week High / Low
2,266/912
Avg. Daily Volume
3,865
Slowdown in automobile industry drags the overall volume growth: Lumax registered
Face Value (`)
10
~17% de-growth on yoy basis on the consolidated revenue front to `402cr as
BSE Sensex
37,655
Nifty
11,133
compared to `482cr yoy. The decline in revenue was majorly due to slowdown in
Reuters Code
LUMA.BO
Bloomberg Code
LUMX IN
PVs and production cut announced by OEMs. Going forward, management expects
company to see recovery in sales due to declining interest rate, pick-up in rural
Shareholding Pattern (%)
volume, and pre-buying for BSVI. The company has also added new customers,
Promoters
75.0
Morris Garage (MG Motors) and TVS motors, which are expected to add `45cr in
MF / Banks / Indian Fls
1.1
incremental revenue in FY20.
FII / NRIs / OCBs
0.0
Overall lower sales impacts profitability: Operating margin improved by 112bps to
Indian Public / Others
23.9
9.5% mainly owing to in-house electronic facilities for manufacturing of PCBs, cost
reduction initiatives, and softening commodity prices. On the bottom-line front, the
Abs.(%)
3m
1yr
3yr
company has reported de-growth of ~17% due to poor sales performance.
Sensex
(1.2)
(1.5)
32.4
Outlook and Valuation: Near term outlook looks tough for the industry, however
LUMAXIND
(28.2)
(28.2)
57.2
considering the long term perspective, LIL is a good bet to play on auto growth and
increasing LED penetration, which will help Lumax to grow above the industry rate
going forward. Thus, we main our buy recommendation on the stock with target
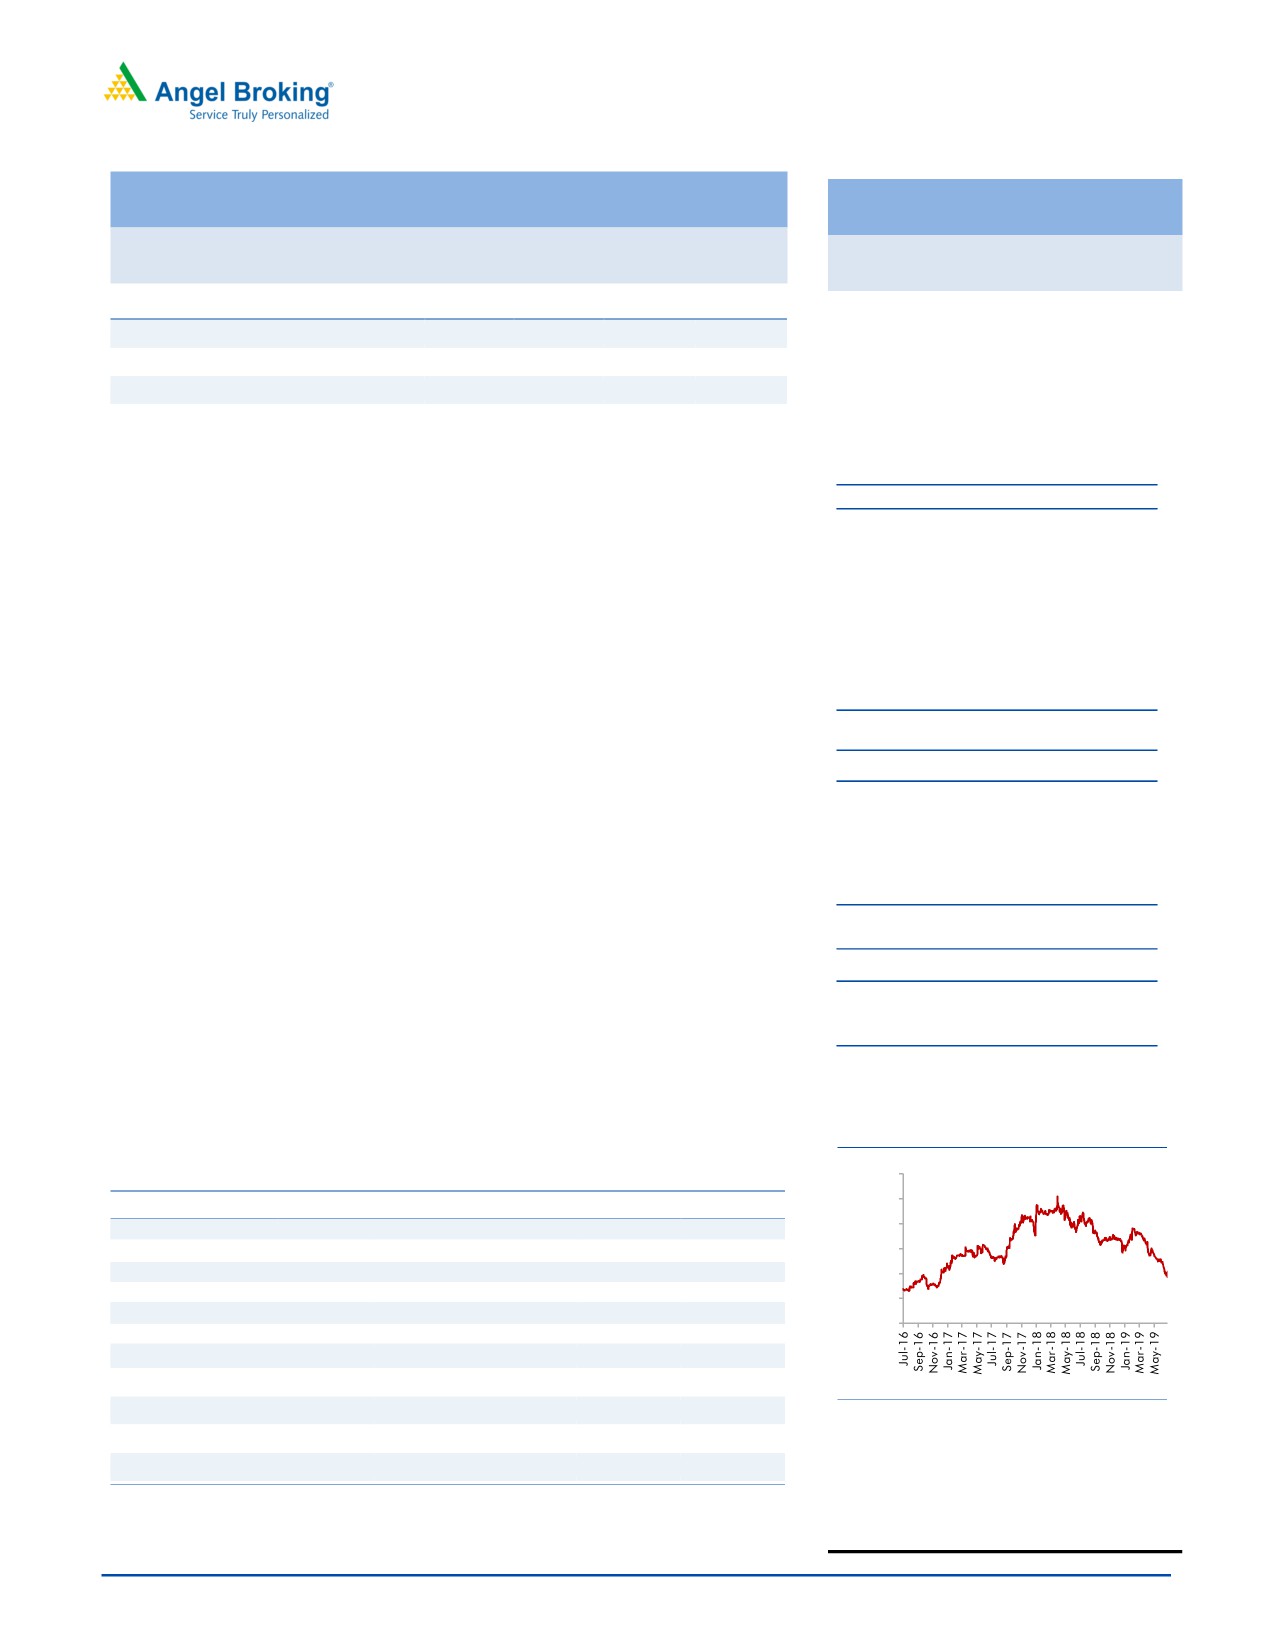
3 Years Performance charts
price of `1669.
3000
Key Financials
2500
Y/E March (` cr)
FY17
FY18
FY19
FY20E
FY21E
2000
Net Sales
1,271
1,650
1,851
1,822
1,968
1500
% chg
1
30
12
(2)
8
Net Profit
54
58
104
80
87
1000
% chg
4
7
79
(23)
8
500
EBITDA (%)
7.9%
8.2%
8.3%
9.1%
9.1%
0
EPS (Rs)
58
62
111
86
93
P/E (x)
22
21
12
15
14
P/BV (x)
3.9
3.3
2.8
2.4
2.1
RoE (%)
17.6
16.0
23.9
16.1
15.1
Source: Capitaline Angel Research
RoCE (%)
15.2
18.7
16.2
16.9
16.4
EV/EBITDA
12.7
9.6
8.5
7.8
7.2
Amarjeet S Maurya
022 39357600, Extn: 6831
Source: Company, Angel Research; Note: CMP as of august 09, 2019
August 09, 2019
1
LUMAX Industries | Q1FY20
Quarterly Financial Update
Y/E March (` cr)
1QFY20
1QFY19
% yoy
4QFY19
% qoq
FY2019
FY2018
% chg
Net Sales
402
482
(16.6)
433
(7.1)
1,851
1,649
12.3
Consumption of RM
239.8
310
(22.6)
273.5
(12.3)
1,183
971
21.8
(% of Sales)
59.6
64.3
63.2
63.9
58.9
Staff Costs
53
54
(1.2)
53
(0.5)
218.0
188.9
15.4
(% of Sales)
13.2
11.2
12.4
11.8
11.5
Other Expenses
71
78
(9.0)
75
(5.5)
297.7
355.6
(16.3)
(% of Sales)
17.6
16.2
17.3
16.1
21.6
Total Expenditure
364
441
(17.6)
402
(9.5)
1,698
1,516
12.1
Operating Profit
38
41
(5.5)
31
24.6
153
134
14.5
OPM
9.5
8.4
7.1
8.3
8.1
Interest
4.6
3.1
50.8
4.6
1.1
15.5
7.2
115.9
Depreciation
15.2
13.3
14.2
19.0
(19.9)
60.3
47.9
25.9
Other Income
4
4
11
56.9
18.9
PBT (excl. Ext Items)
23
28
(18.3)
18
22.7
134
98
37.7
Ext (Income)/Expense
PBT (incl. Ext Items)
23
28
(18.3)
18
22.7
134
98
37.7
(% of Sales)
5.6
5.8
4.3
7.3
5.9
Provision for Taxation
6
8
4
30.5
26.2
(% of PBT)
27.0
27.8
22.9
22.7
26.9
Reported PAT
17
20
(17.4)
14
16.2
104
71
45.5
PATM
4.1
4.2
3.3
5.6
4.3
Minority Interest After NP
Extra-ordinary Items
28
Reported PAT
17
20
(17.4)
14
16.2
75.8
71.4
6.3
Source: Company, Angel Research
August 09, 2019
2
LUMAX Industries | Q1FY20
Outlook and Valuation:
Near term outlook looks tough for the industry, however considering the long term
perspective, LIL is a good bet to play on auto growth and increasing LED penetration,
which will help Lumax to grow above the industry rate going forward. Thus, we main
our buy recommendation on the stock with target price of `1669.
Risks to our estimates
Slower than expected adoption of LED lights by OEMs and higher content of
impored raw material pose a downside risk to target revenue and net income
respectively.
Faster growth in PV and 2W segments pose an upside risk to target revenue.
August 09, 2019
3
LUMAX Industries | Q1FY20
Income statement
Y/E March (` cr)
FY18
FY19
FY20E
FY21E
Total operating income
1,650
1,851
1,822
1,968
% chg
30
12
(2)
8
Total Expenditure
1,515
1,698
1,657
1,789
Raw Material
1,104
1,183
1,152
1,240
Personnel
189
218
200
217
Selling and Administration Expenses
107
-
-
-
Others Expenses
115
298
304
333
EBITDA
135
153
165
179
% chg
33.9
13.4
7.9
8.4
(% of Net Sales)
8.2%
8.3%
9.1%
9.1%
Depreciation& Amortisation
48
60
63
68
EBIT
87
93
102
111
% chg
46
7
10
9
(% of Net Sales)
5
5
6
6
Interest & other Charges
8
16
18
20
Other Income
5
12
17
19
Extraordinary Items
-
36
Profit/Loss of Associate Company
13
9
9
9
Recurring PBT
98
134
110
119
% chg
51
38
(18)
8
Tax
26
30
30
32
PAT (reported)
71
104
80
87
% chg
31
45
(23)
8
(% of Net Sales)
4.3
5.6
4.4
4.4
Basic & Fully Diluted EPS (Rs)
62
111
86
93
% chg
7
79
(23)
8
Source: Company, Angel Research
August 09, 2019
4
LUMAX Industries | Q1FY20
Balance Sheet
Y/E March (`cr)
FY18
FY19
FY20E
FY21E
SOURCES OF FUNDS
Equity Share Capital
9.4
9.4
9.4
9.4
Reserves& Surplus
353
426
490
563
Shareholders Funds
362
435
499
573
Total Loans
101
138
102
102
Other Liabilities
47
42
42
42
Total Liabilities
510
615
643
717
APPLICATION OF FUNDS
Net Block
532
549
599
639
Capital Work-in-Progress
34
49
49
49
Investments
88
81
73
79
Long Term Loans & Advances
4
5
5
5
Current Assets
562
465
503
541
Inventories
169
204
225
243
Sundry Debtors
318
221
250
270
Cash
2
2
6
-2
Loans & Advances
1
1
1
2
Investments & Others
73
37
21
28
Current liabilities
721
574
602
627
Net Current Assets
-159
-109
-100
-87
Other Non Current Asset
11
40
24
48
Total Assets
510
615
643
717
Source: Company, Angel Research
Cash Flow
Y/E March (`cr)
FY18
FY19E
FY20E
FY21E
Profit before tax
98
134
110
119
Depreciation
48
60
63
68
Change in Working Capital
17
(132)
(115)
(50)
Interest / Dividend (Net)
8
16
18
20
Direct taxes paid
26
30
30
32
Others
(40)
(30)
(30)
(32)
Cash Flow from Operations
157
78
77
157
(Inc.)/ Dec. in Fixed Assets
(132)
9
(80)
(80)
(Inc.)/ Dec. in Investments
4
(4)
(7)
(18)
Cash Flow from Investing
(128)
5
(87)
(98)
Issue of Equity
-
-
-
-
Inc./(Dec.) in loans
19
36
-36
-
Others
(30)
(134)
49
(67)
Inc./(Dec.) in Cash
17
(15)
3
(8)
Opening Cash balances
1
19
4
6
Closing Cash balances
19
4
6
6
Source: Company, Angel Research
August 09, 2019
5
LUMAX Industries | Q1FY20
Key Ratio
Y/E March
FY18
FY19
FY20E FY21E
P/E (on FDEPS)
20.8
11.6
15.0
13.9
P/CEPS
11.3
7.3
8.4
7.8
P/BV
3.3
2.8
2.4
2.1
Dividend yield (%)
1.1
2.0
1.3
1.1
EV/Sales
0.8
0.7
0.7
0.7
EV/EBITDA
9.6
8.5
7.8
7.2
EV / Total Assets
2.3
2.3
2.3
1.7
Per Share Data (Rs)
EPS (Basic)
62.0
111.0
85.8
92.7
EPS (fully diluted)
62.0
111.0
85.8
92.7
Cash EPS
113.8
175.5
153.7
165.8
DPS
14.4
25.9
17.2
13.9
Book Value
387.2
465.1
533.8
612.6
Returns (%)
ROCE
16.0
23.9
16.1
15.1
Angel ROIC (Pre-tax)
18.7
16.2
16.9
16.4
ROE
22.4
19.2
19.7
18.8
Turnover ratios (x)
Inventory / Sales (days)
37
40
45
45
Receivables (days)
70
44
50
50
Payables (days)
119
75
70
70
Working capital cycle (ex-cash) (days)
(11)
9
25
25
Source: Company, Angel Research
August 09, 2019
6
LUMAX Industries | Q1FY20
Research Team Tel: 022 - 39357800
DISCLAIMER:
Angel Broking Limited (hereinafter referred to as “Angel”) is a registered Member of National Stock Exchange of India Limited, Bombay Stock
Exchange Limited, Metropolitan Stock Exchange Limited, Multi Commodity Exchange of India Ltd and National Commodity & Derivatives Exchange
Ltd It is also registered as a Depository Participant with CDSL and Portfolio Manager and Investment Adviser with SEBI. It also has registration
with AMFI as a Mutual Fund Distributor. Angel Broking Limited is a registered entity with SEBI for Research Analyst in terms of SEBI (Research
Analyst) Regulations, 2014 vide registration number INH000000164. Angel or its associates has not been debarred/ suspended by SEBI or any
other regulatory authority for accessing /dealing in securities Market. Angel or its associates/analyst has not received any compensation /
managed or co-managed public offering of securities of the company covered by Analyst during the past twelve months.
This document is solely for the personal information of the recipient, and must not be singularly used as the basis of any investment decision.
Nothing in this document should be construed as investment or financial advice. Each recipient of this document should make such investigations
as they deem necessary to arrive at an independent evaluation of an investment in the securities of the companies referred to in this document
(including the merits and risks involved), and should consult their own advisors to determine the merits and risks of such an investment.
Reports based on technical and derivative analysis center on studying charts of a stock's price movement, outstanding positions and trading
volume, as opposed to focusing on a company's fundamentals and, as such, may not match with a report on a company's fundamentals. Investors
are advised to refer the Fundamental and Technical Research Reports available on our website to evaluate the contrary view, if any
The information in this document has been printed on the basis of publicly available information, internal data and other reliable sources believed
to be true, but we do not represent that it is accurate or complete and it should not be relied on as such, as this document is for general guidance
only. Angel Broking Limited or any of its affiliates/ group companies shall not be in any way responsible for any loss or damage that may arise
to any person from any inadvertent error in the information contained in this report. Angel Broking Limited has not independently verified all the
information contained within this document. Accordingly, we cannot testify, nor make any representation or warranty, express or implied, to the
accuracy, contents or data contained within this document. While Angel Broking Limited endeavors to update on a reasonable basis the
information discussed in this material, there may be regulatory, compliance, or other reasons that prevent us from doing so.
This document is being supplied to you solely for your information, and its contents, information or data may not be reproduced, redistributed or
passed on, directly or indirectly.
Neither Angel Broking Limited, nor its directors, employees or affiliates shall be liable for any loss or damage that may arise from or in connection
with the use of this information.
Disclosure of Interest Statement
Lumax Industries
1. Financial interest of research analyst or Angel or his Associate or his relative
No
2. Ownership of 1% or more of the stock by research analyst or Angel or associates or relatives
No
3. Served as an officer, director or employee of the company covered under Research
No
4. Broking relationship with company covered under Research
No
August 09, 2019
7